Automated Biking Network Planning

by URBINTEL

Motivation

Improving safe cycling in a city has great benefits in many areas:

  • motor traffic congestion and emissions, amount of parking needed;
    • Our plan to reduce carbon emissions in Canada by at least 0.1%;
    • "The world’s 280 million electric bikes and mopeds are cutting demand for oil far more than electric cars." [theconversation.com]

  • access to workplaces (and commerce, community, entertainment, etc.);
  • health benefits (cardiovascular, metabolic, mental, etc.);
  • economic impact on commerce;
  • cycling gender parity and access for more vulnerable individuals (children, elderly, ...);
  • leisure cycling, city beautification, tourism;
  • cargo bike access for package delivery;
  • Top leaders: [Meghan Winters el al.] [Janette Sadik-Khan].
  • "Could Building Bike Lanes Become America’s Next Big Infrastructure Project?" [usa.streetblog.org]
    • "Bike lanes and trails aren't just small, local projects; they're key components of a national effort to end climate change."


Bicycle Tracks

Our technology plans the locations of new bicycle tracks on the existing road and path network:


    Cyclist Profile

    Our analysis and planning of the cycling network require a model for the behaviour of the typical cyclist:

    • Bicycle trips are calculated from all residential locations to all non-residential locations, using a routing engine.
    • Maximum speed: 18 km/h; maximum trip time: 30 minutes; minimum: 10 minutes.

    • Level of Traffic Stress (LTS) applies a speed penalty that increases with danger level.
    • Road surface type speed penalty based on [OSRM:bicycle.lua].
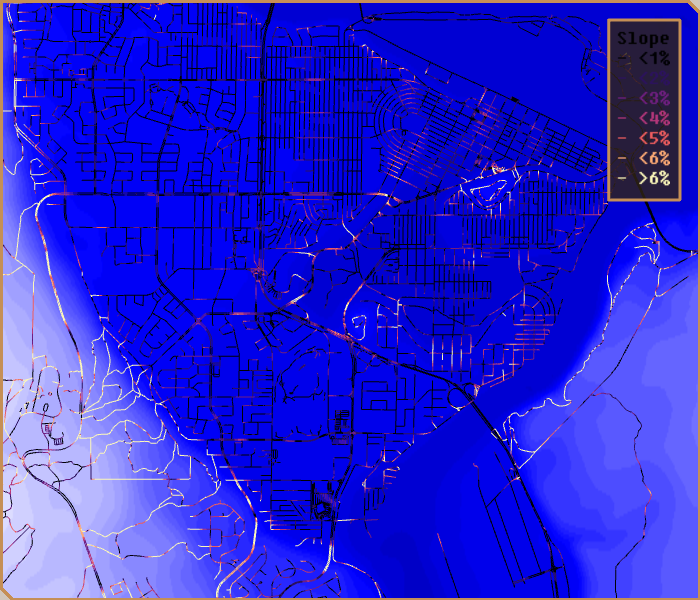
    • Slope climbing speed penalty based on [J Broach, J Dill, J Gliebe] [M Lowry, P Furth, T Hadden-Loh] [C Cooper].
    • Speed penalties are NOT cumulative: rather, the worst penalty applies.
    • Routing engine finds fastest route, thus avoiding poor biking conditions if an alternative route is available.
    • "Four Types of Cyclists" [R Geller]


    Why Partner with Us?

    A turn-key solution for biking network analysis and planning for your city.

    • A custom-built routing engine that is ultra-fast, (20x faster benchmark than the fastest available: OSRM), allowing for the analysis of many scenarios for your city.
    • Currently works for Canada and the USA, for cities up to 2,000,000 population. We hope to extend this to further countries and larger cities in the future.
    • We use only open data, so there are no data costs or privacy concerns.
    • Road conflation technology allows combining city's open data (Shapefiles) with OpenStreetMap data.
    • Results presented both as image and as vector data (Shapefile or similar).
    • Research expertise in biking GIS. Reports for Transport Canada [Szyszkowicz 2018], Public Health Agency of Canada [Szyszkowicz 2019], Province of British Columbia [Szyszkowicz 2022].
    • Previous clients (Canada): Sherbrooke QC, Peel Region ON, Hamilton ON, Nanaimo BC, Kamloops BC, Prince George BC, IKEA Corp. Vancouver BC.


    Methodology


    Level of Traffic Stress (LTS)

    Well-established rating system for biking safety on a road:

    • Rating can be derived from road properties found in typical open data
    • A function of road type, posted speed limit, on-street parking, number of lanes, cycling infrastructure.
    • Can also include measured traffic intensity (ADT/AADT) if available.
    • [Mineta Institute, M Mekuria, P Furth, H Nixon].
    • It is possible for the LTS rating to be different in both travel directions.
    • LTS used in the Bicycle Network Analysis project.

    Topography and Slope

    • Source: Natural Resources Canada (NRCan)

    Population Density

    • Source: Canadian census [visualization].
    • Within each census parcel ("dissemination area" in Canada), the population is distributed uniformly on the residential streets for simulation purposes.


    Workplace Density

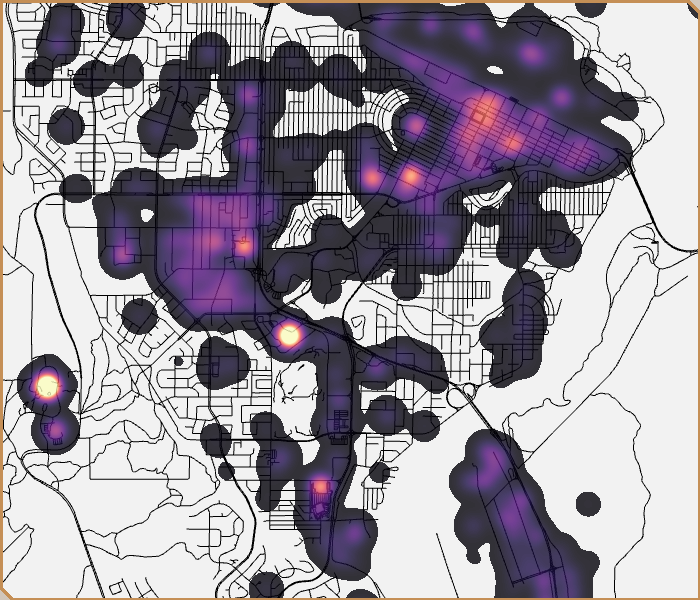
    • Based on building volume and type.
    • Buildings taken from OpenStreetMap or city open data.
    • Alternatively, can be based on business listing with locations and number of employees, if available.


    Priority Biking Network Interventions

    Output of algorithm: where to place protected bike tracks.

    Cycling Potential Curve

    Second output of algorithm: tradeoff curve between making the most urgent infrastructure improvements and amount of biking trips improved.

    • In this example, building only the most urgent 13% (14 km) of the bike network length results in 50% of the potential gains.

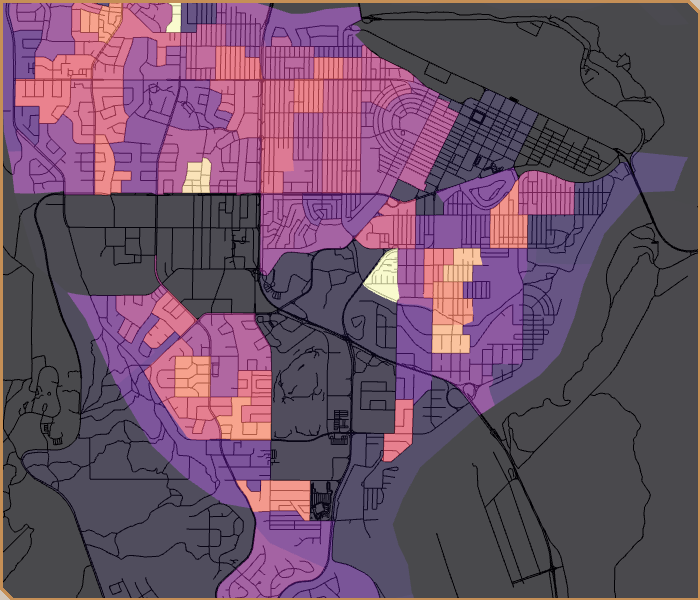
    Residential Neighbourhood Accessibility

    Third output of algorithm: accessibility of neighbourhoods to workplaces (lighter colours represent better access).

    External Resources


    Other Significant Projects Related to Biking Networks


    Routing Engines with Biking Profiles


    Some Cycling Plans

    Email Us